

Technology
Built on each athlete's own data.
Opti-U builds a digital twin of each athlete from telemetry, wearables and daily check-ins, then puts it to work through the club dashboard, the athlete app, small experiments and a twelve-week coaching course.
- Digital twin
- Club dashboard
- Athlete app
- Twelve-week course
The digital twin
A live statistical model of every athlete.
The twin runs on Opti-U Core, a platform of about 200,000 lines of code built for one job: learning how one person's body behaves and forecasting what comes next.
<01>
Personal baselines
Robust baselines are fitted to each athlete for every measure. A reading only counts as a change once it passes the smallest detectable change for that measure, so staff stop chasing noise.
<02>
State-space modelling
A state-space model with Kalman filtering estimates each athlete's underlying state through noisy readings and updates it with every new observation.
<03>
Monte Carlo forecasting
Simulation runs the model forward to forecast sleep, HRV and resting heart rate 14 days ahead and recovery 7 days ahead. Each forecast carries a calibrated range, and every next-day forecast is checked against the reading that follows.
<04>
Pattern memory
The twin searches the athlete's history for periods that resemble today, scores how similar they are and shows what followed each one.
<05>
Injury risk and burnout modelling
Comparable earlier days and what followed them drive forecasts of injury, illness, physical burnout and performance dip over 14 to 21 days, anchored to the squad's usual rate.
<06>
Causal analysis
TMLE and AIPW estimators, with single-athlete experiments, separate what caused a change from what happened alongside it.
<07>
Evidence on every output
Each value carries its model version, data source, calibration status, horizon, range and data sufficiency. Forecasts are reproducible, because they come from the statistical models. Language models read the findings, interpret them for the athlete and write the coaching and weekly plan. They do no calculations.
The club dashboard
The whole squad, read one player at a time.
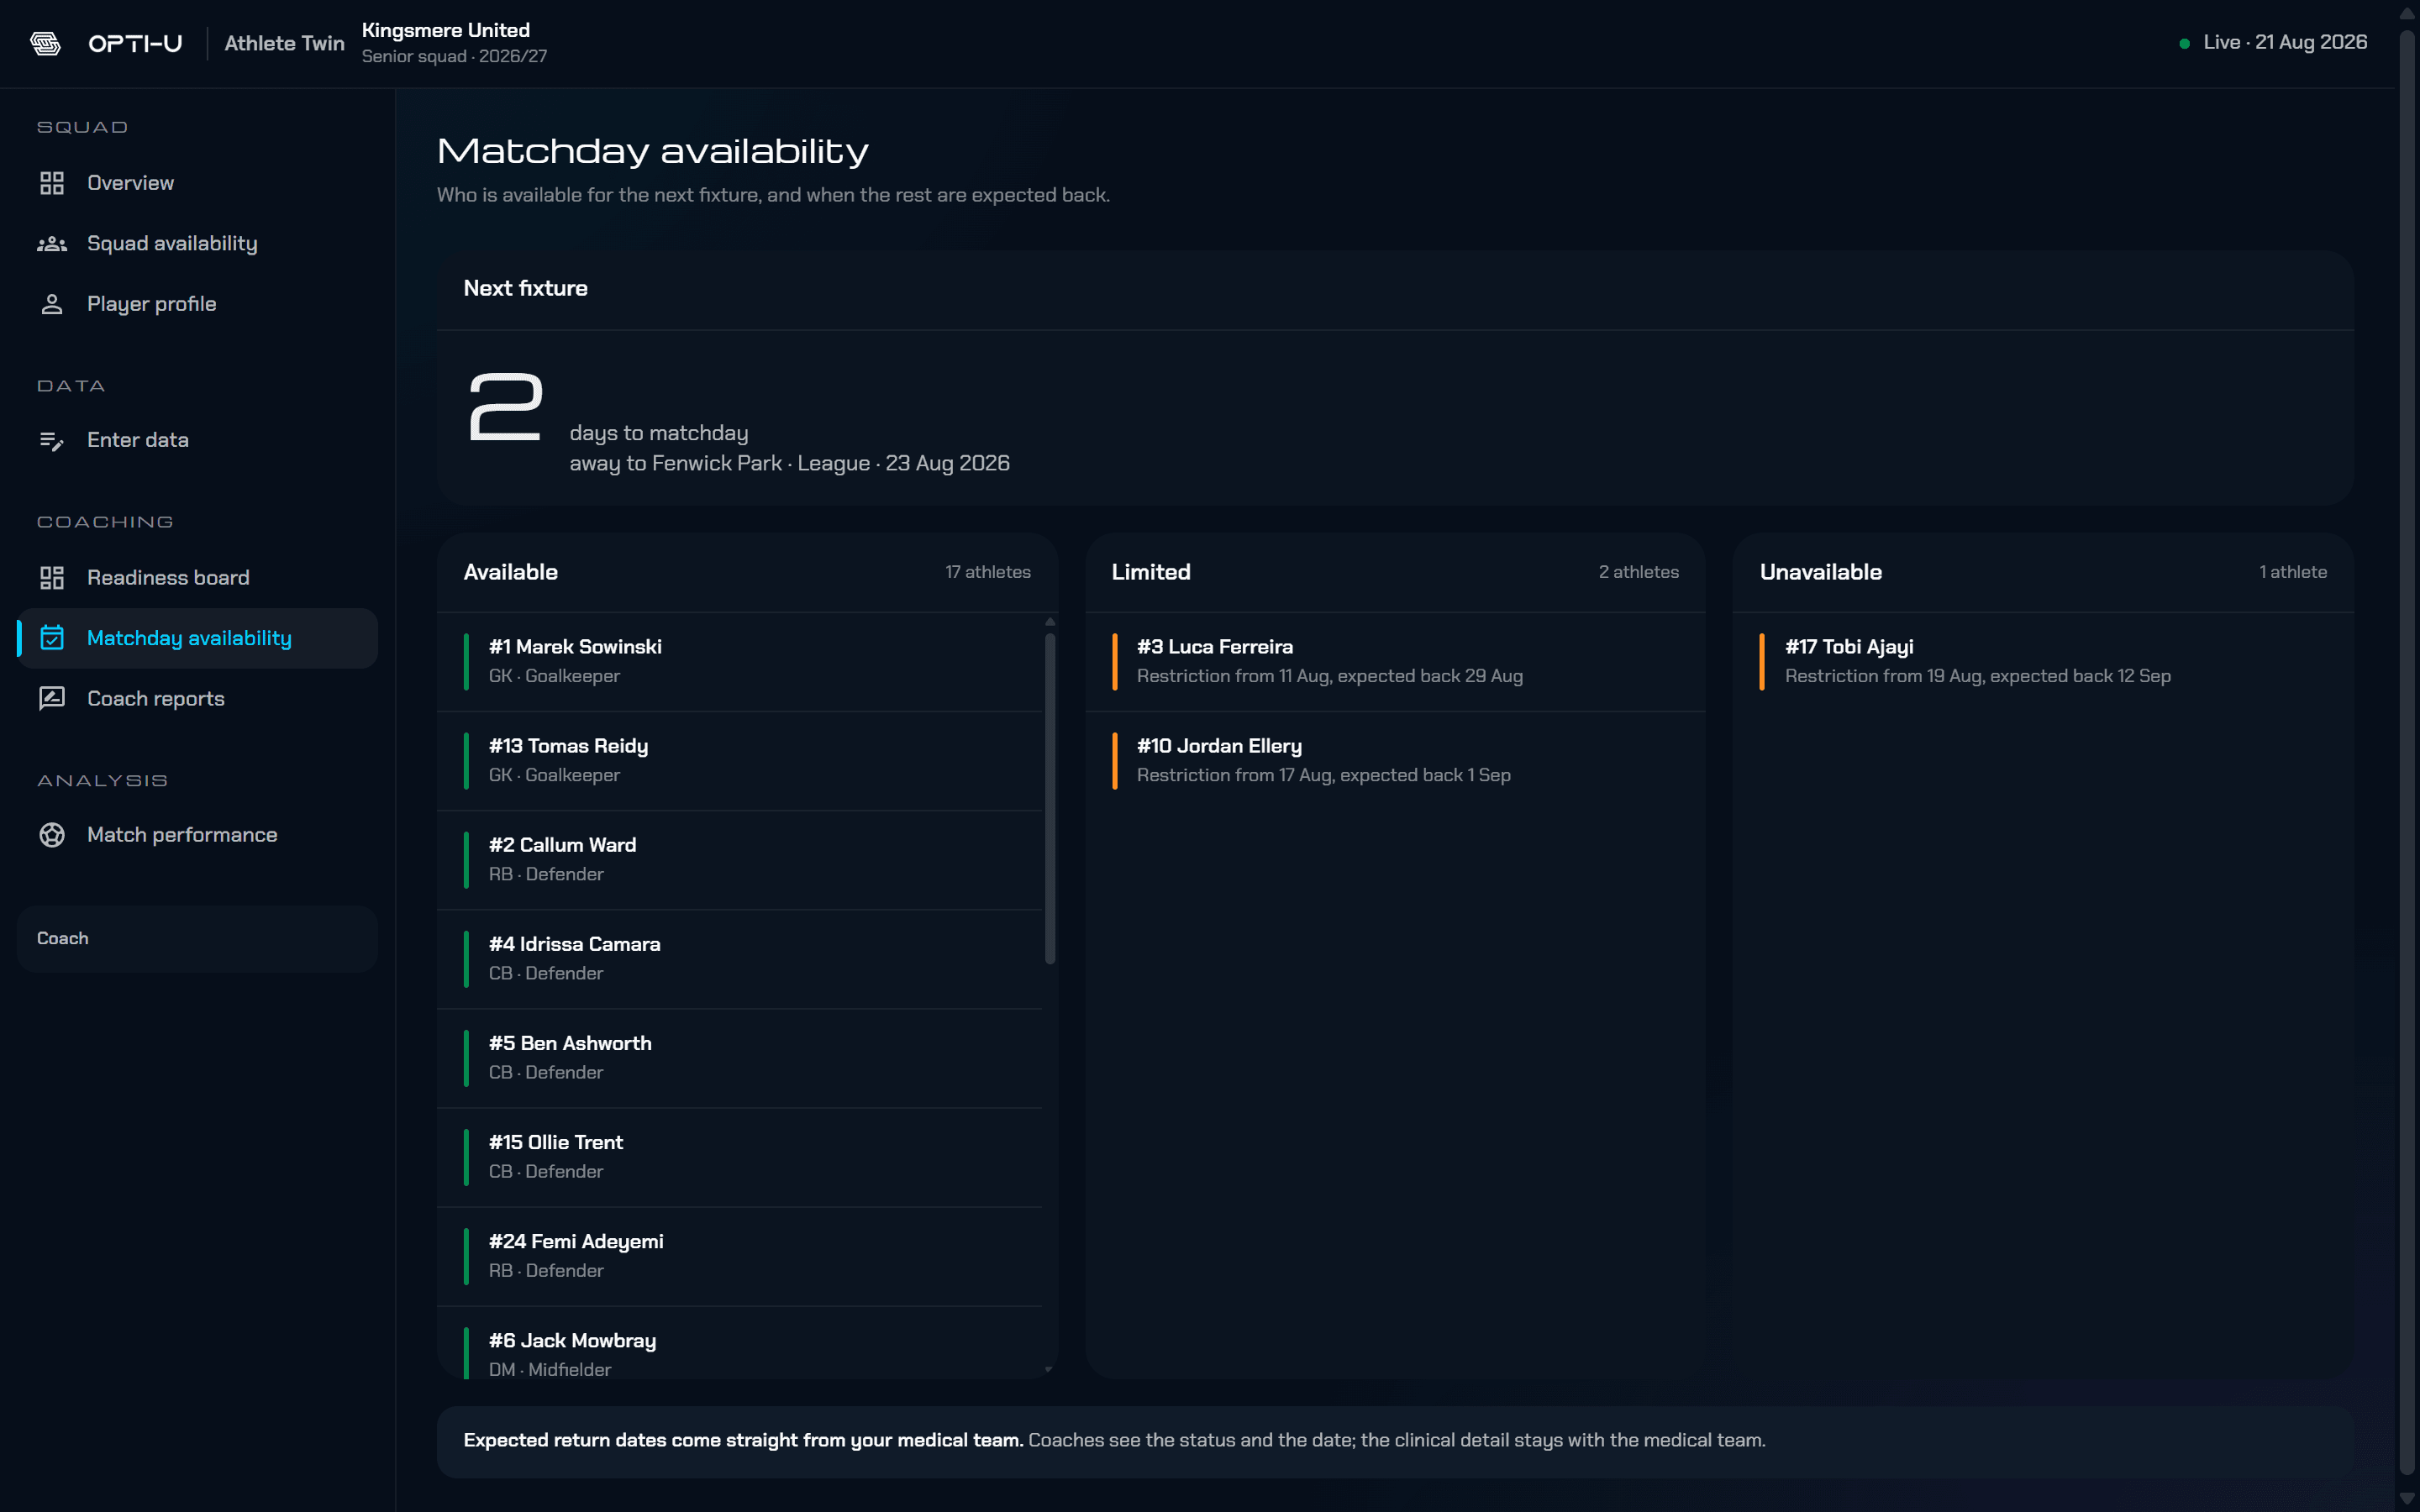
The dashboard turns every twin into the morning's decisions. It sits above the GPS and athlete management systems a club already runs, so staff get one picture without changing a single vendor. These screens come from our working design prototype, on simulated data.
Under the dashboard
Built for the way a performance department works.
<01>
GDPR by design
Player health data is handled as special category data under UK and EU GDPR. Purpose-based consent, data subject rights and data protection impact assessment are built into the platform.
<02>
Eight discipline portals
Medical, performance, sports science and S&C, coaching, analysis, nutrition, psychology and leadership each open on their own view of the squad.
<03>
Changed since yesterday
Each morning opens on availability and the players who moved, ranked by how much they changed.
<04>
One intake for every vendor
The sports layer maps each athlete to their vendor IDs and brings GPS load, session RPE, wellness, fixtures and availability into a single record.
<05>
Access tiers and firewalls
Each role sees only its own tier. Medical and psychology records sit behind separate firewalls, and leadership sees counts rather than names.
<06>
A decision log
Staff record what was decided, the alternatives weighed and who signed it off. Over seasons, that record shows which interventions work for which players.
<07>
A tamper-evident audit chain
Every read of an athlete's record is hash-chained, and the athlete can see who viewed it.
01. Course design
A twelve-week course built on behavioural research.
The course follows established behaviour-change methods. Each week's targets are set from how the previous week went.
02. Habits
Habit targets that move with each athlete's week.
A target can go up or down depending on the athlete's recovery, workload and progress toward the goal they set.
03. Digital Twin
A statistical model of each athlete.
The Digital Twin models how each athlete sleeps, recovers and responds to training load. Recommendations are checked against it before they reach the athlete.
04. Experiments
N=1 experiments.
An N=1 experiment tests one change on one person against that person's own baseline. Changes that help stay in the plan and the others are dropped. The data behind each decision stays visible to the athlete.
Methods
The statistics behind the coaching.
Opti-U uses statistical inference and causal modelling to judge whether a change is working. AI writes the coaching around those results, and its output is checked against rules on what it is allowed to recommend.